
2015年3月13日星期五
Week 6: The Bench Inspection
The bench inspection is generally successful today, and here is the product for our project.
2015年3月12日星期四
Week 6: Prepared for the Bench Inspection Tomorrow
This is the week for the bench inspection, and it will be held tomorrow.
In the bench inspection, we will give a presentation for the tutor and the another accessor. In this section, Lu Huimin will talk about the Introduction part and she will introduce all the group members. For the Methodology part, Mao Mengkai will explain three key words in the software Homer Energy in our project. Then Ni Kai will briefly talk about the results for this project and mainly discuss the information on the graphs. At last Shan Xin will talk about the Discussion and Conclusion parts, and he will analyze the key points in the project.
After the presentation is over, the group leader Ni Kai will demonstrate the software Homer Energy and make the listeners briefly understand the process. All the members are prepared for the questions that may be asked.
Here is the final poster for the project:
2015年3月7日星期六
Week 5: The summary of the Meeting with Dr. Jiang and the Lab Day
The meeting with Dr. Jiang at 05/03/2015:
All the members were at Dr. Jiang's office on this day, and we displayed the draft of our final report for Dr. Jiang. Dr. Jiang looked through it and asked us to emphasize the Methodology part of the report as it give important information for the readers. The MATLAB simluation results should be simplified because they are just the appoarches to derive data, not the purpose of this project. Furthermore, the understanding of major concepts in HOMER ENERGY is not familiar to the members in this group, and we need to have the ability to interpret what we have learned to the listeners in the presentation.
The Lab Day at 06/03/2015:
On this day, all the members gathered together to revise the report to make the logic clear and some complex parts were removed. After the report is adjusted, the poster is almost completed, and the design for the poster has been changed a little bit today.
Here is the poster designed on the lab day:
 After a meeting today, the methodology part will be simplified and the Abstract part will be added. In addition, the sensitivity analysis for the second case will be changed into the relationship between the PV production and the solar radiation rate.
Here is the poster revised today:

All the members were at Dr. Jiang's office on this day, and we displayed the draft of our final report for Dr. Jiang. Dr. Jiang looked through it and asked us to emphasize the Methodology part of the report as it give important information for the readers. The MATLAB simluation results should be simplified because they are just the appoarches to derive data, not the purpose of this project. Furthermore, the understanding of major concepts in HOMER ENERGY is not familiar to the members in this group, and we need to have the ability to interpret what we have learned to the listeners in the presentation.
The Lab Day at 06/03/2015:
On this day, all the members gathered together to revise the report to make the logic clear and some complex parts were removed. After the report is adjusted, the poster is almost completed, and the design for the poster has been changed a little bit today.
Here is the poster designed on the lab day:
Here is the poster revised today:
2015年2月28日星期六
Week 4: The Lab Day
Yesterday was the lab day, and all the members were present in the computer laboratory. As the sections of processing data and doing analysis have been basically finished, our team is now working on the part of displaying the results and explaining the principles.
Before this day, the members completed three reports for the three cases we focused on. I was combining the contents to the main part of the final report. For Mengkai Mao, the task was writing the introduction which is divided into three parts: the three cases, a micro-grid and Homer Energy. Because these three parts are all the cores for our project, we need to introduce them to the readers. As a bench inspection will be held in two weeks, I asked Huimin Lu to design the poster for our project. Shan Xin and I were revising the contents for the report and we discussed which part to be paid attention to.
Before this day, the members completed three reports for the three cases we focused on. I was combining the contents to the main part of the final report. For Mengkai Mao, the task was writing the introduction which is divided into three parts: the three cases, a micro-grid and Homer Energy. Because these three parts are all the cores for our project, we need to introduce them to the readers. As a bench inspection will be held in two weeks, I asked Huimin Lu to design the poster for our project. Shan Xin and I were revising the contents for the report and we discussed which part to be paid attention to.
2015年2月26日星期四
Week 4: Meet the supervisor Dr. Lin Jiang
Today all the members in our group met the tutor Dr. Lin Jiang in his office. This week we wrote three reports to introduce the situations for the three cases, show the methods of obtaining and processing data, and analyze the results. As the logic of the reports is clear and the methods used are reasonable, Dr. Jiang was satisfied with our achievements.
The important point is that for the presentation section, we need to have the ability to explain the principles of optimizations and sensitivity simulations so that the listeners can understand what we have done. Dr. Jiang appreciated that it is a good practice for our final report and also for the future of being an engineer.
What we are going to do next is sort out all the information and complete a draft for the final report, and then it will be much easier to prepare for the presentation and the poster.
2015年2月25日星期三
Week 4: Summary and Achievements for two meetings
This week two group meetings were held.
The first one is on 22/2/2015 Sunday, and all the members were present. A draft report for the first case was written by Ni Kai, and the other members had a look at it, and they discussed the structure of the draft, and gave some advice on it. Some parts of the draft were revised to make the overall description more clear. After that, the members were divided into two groups to write drafts for the second and third cases by using the draft for the first case as a model. The members were encouraged to add contents which are useful for explaining the simulation results to the reports. All the members discussed the sustainable design and ethics aspect report which was written by Lu Huimin, and revised some parts of it.
The second one is on 25/2/2015 which is today, Wednesday, and all the members were present. Three reports for three cases were finished, and the members looked through all the reports, and there are too many details for the group to analyze. As a lot of data is not easy to be analyzed, the members selected some vital data. By using graphs, the results can be explained from different degrees, and the question is that which degree is the most important one. The sustainable design report was submitted via Vital today as well.
2015年2月20日星期五
Week3: Meeting the Supervisor and the Lab Day
Yesterday all the members in our group met Dr. Jiang in his office. We decided to show him the achievements we got in the last two weeks, and I brought my laptop there to display the simulation results and the contents on my logbook.
Dr. Jiang appreciated our efforts, while he gave us some advice. It is important that we present our results to him in the form of a report, while the contents in the logbook were in the form which is similar to a diary and is not clear enough. Dr. Jiang advised us to introduce more about the software Homer Energy, and explain more about the principles of calculating the results. Once we explain the principles to the listeners, they will be able to learn what we have done in this project.
Today is the third lab day, and we finished the simulations for the three cases together. In the morning, Shan Xin sorted all the important formulas in the software and gave some tips for them. Mao Mengkai worked on a mini report of introducing micro-grids and he searched for relevant information of applications of Homer Energy. Lu Huimin was asked to write the report for sustainable development which is required for each group. I was focusing on complete the data for each case by using Homer Energy.
In the afternoon, we discussed the statistics for the components in the three cases, and did simulations for many times to examine the resonability of the data. After a large amount of simulations, we researched the results and solved some of the problems. After the lab, we decided to finish a brief report for case 1 on Sunday and then it would be easier to finish the others.
2015年2月18日星期三
Week 3: A brief meeting today
Today all the members in our group had a meeting to accumulate the achievements from each one.
As a group leader, I studied the next two cases and recorded some information I found on the Internet. Mao Mengkai and Lu Huimin were asked to gather information for these two cases as well. Lu Huimin derived relevant data for the second case and Mao Mengkai did the same thing for the third case. Shan Xin optimized some data for the first case and revised the Matlab code.
As a group leader, I studied the next two cases and recorded some information I found on the Internet. Mao Mengkai and Lu Huimin were asked to gather information for these two cases as well. Lu Huimin derived relevant data for the second case and Mao Mengkai did the same thing for the third case. Shan Xin optimized some data for the first case and revised the Matlab code.
2015年2月16日星期一
MATLAB simulation
our group optimized
our design of micro power system regards on the Diavik Diamond Mine, which is
Canada's largest diamond mine. I was responsible for estimating the power in
load.

Figure 1 shows the primary load of Power Energy. The
load requires the specific power
consumption. However, we only has the data of
the total power consumption of a year in this case. Due to the limitation of
the data, Mento-Carlo medal was applied to simulate the power consumption in
each month.

Figure 2. Results
of MATLAB simulation
%7DRRGO734G_%24_W%7BM8O1CNJ.png)

Figure 4. Distribution of simulated power
According to the
data, Diavik Diamond Mine consumes 16977 MWH power each year, with peak power
in winter. Figure 2 to figure 4 shows the results that simulated by MATLAB.
Mento-Carlo method is applied to generate random data. According to the data
that the peak power in a city is two times the low demand period.
2015年2月15日星期日
Week 3: A group meeting
The first group meeting was held today in Harold Corhen Library. All the group members were present, and we discussed the updated information for our project.
The project is under construction these days, and the analysis for the first case Diavik Mine is completed, which is going to be improved for many times. By studying the situation of the load in a city of China, we decided to make some changes to our data, which is balancing the differences between the requirements of electricity each month. The wind speed situation in Canada is found on the Internet and we are going to adjust the original data.
I checked the logbooks for all the members and asked them to put the achievements they got in the last two weeks in the books.
New tasks are distributed for my team members:
Shan Xin is going to improve the Matlab function and derive more suitable data for the wind speed and load.
Lu Huimin will search for statistics for the second case.
Mao Mengkai will search for statistics for the third case.
2015年2月14日星期六
Week 2: The second lab
Yesterday was the day for the second lab, and the purpose of the lab for our group was to finish the establishment of the micro-grid for the first case, Diavik Mine in Canada.
With the general information of this case, we started building up the micro-grid for this region. As there is a big mine, fossil fuel was the main resource for producing electricity. While burning fossil fuels damages the environment, and the wind speed there is suitable for developing a electricity station of wind. Our group focused on designing the micro-grid under this case and optimizing the system.
On this day, I allocated different jobs for each member. Lu Huimin was asked to look for data of the wind turbines Enercon and GE 1.5sl, and she searched for information of the situation of using electricity in Diavik. Mao Mengkai was searching for information of the wind turbines GEV-MP-C and GEV-MP-R, and the information for several storage batteries. Shan Xin used Matlab to create random numbers to represent the energy consumed at the load for each month, with high consumption in January, Feburary and December.
I built up the microgrid and determined the parameters for each component by using the data derived from my teammates, and finished the simulation for the first case, and here are the results:


However, it is only the simplest model for this system, and we will optimize it by refining the data and delete unnecessary statistics to make it more realistic, and this is what we will do next week, and the establishments of the other two micro-grids must be finished until the end of the next week.
With the general information of this case, we started building up the micro-grid for this region. As there is a big mine, fossil fuel was the main resource for producing electricity. While burning fossil fuels damages the environment, and the wind speed there is suitable for developing a electricity station of wind. Our group focused on designing the micro-grid under this case and optimizing the system.
On this day, I allocated different jobs for each member. Lu Huimin was asked to look for data of the wind turbines Enercon and GE 1.5sl, and she searched for information of the situation of using electricity in Diavik. Mao Mengkai was searching for information of the wind turbines GEV-MP-C and GEV-MP-R, and the information for several storage batteries. Shan Xin used Matlab to create random numbers to represent the energy consumed at the load for each month, with high consumption in January, Feburary and December.
I built up the microgrid and determined the parameters for each component by using the data derived from my teammates, and finished the simulation for the first case, and here are the results:
However, it is only the simplest model for this system, and we will optimize it by refining the data and delete unnecessary statistics to make it more realistic, and this is what we will do next week, and the establishments of the other two micro-grids must be finished until the end of the next week.
2015年2月12日星期四
Week 2: The second meeting with Dr. Jiang
Today all the group members met Dr. Jiang and reported to him about our progress this week. Main achievements of this week are that the background information of several renewable energy resources and microgrids is collected, and the three cases for study are determined and relevant information is collected, and we learned how to use the software Homer Energy to analyse data for a microgrid. All the achievements have been attached to the blog.
However, there are some problems for our project, and Dr. Jiang gave us some advice. He strongly recommended that we record all the progresses in our log books and sort them out to make the ideas clear, which will be quite helpful for our report writing. The mannual of Homer Energy was not closely researched by us, and if we want to finish a good project, it is necessary for us to clearly research the instructions and white papers for this software. Homer Energy is a great software for investigating analysis, optimization and sensitivity for microgrids, and Dr. Jiang recommended us to use it wisely.
After this meeting, we decided to focus on designing and analysing the microgrids based on the different cases, and the title for our project may be changed when we write the report. The most important thing to do for the next step is closely learning the ways of using Homer Energy and then take advantage of it to analyse and optimize our designs.
2015年2月10日星期二
Week 2: information about third case St Paul Island, Alaska
The largest of the Pribilof Islands, St. Paul contains numerous young cinder cones. St. Paul Island consists of a 110 sq km area of coalescing small basaltic-to-trachybasaltic shield volcanoes capped by cinder cones, similar in style to the Snake Rive Plain volcanism in Idaho. The most widely exposed lava flows originated from E-W-trending vents in the Bogoslof Hill area in the center of the island and a NE-trending row of cinder cones in the Rush Hill area at the west side of the island. Subaerial activity at St. Paul began about 540,000 years ago and produced a basaltic lava platform. Later eruptions produced a series of monogenetic vents and two small shield volcanoes. Bogoslof Hill in the center of the island and Hutchinson Hill, forming isolated Northeast Point, which is connected by a low narrow isthmus to the rest of the island, were formed during the Pleistocene. The youngest vent is the Fox Hill cinder cone on the western side of the island that produced a lava flow about 3200 years ago that traveled into the sea at Southwest Point.
Here is the map for St Paul Island:

Information is available from:
http://www.volcano.si.edu/volcano.cfm?vn=314010
Here is the map for St Paul Island:
Information is available from:
http://www.volcano.si.edu/volcano.cfm?vn=314010
Week 2: information about second case Marble Bar, Australia
Marble Bar is a town located in Western Australia. It is well known for its extremely hot weather. Its population is almost 200 in 2006.
Here is the map for Marble Bar:

· The average annual temperature is 27.7 degrees Celsius (81.9 degrees Fahrenheit). See the temperatures page for a monthly breakdown and the fixed scale graph.
· Average monthly temperatures vary by 15 °C (27°F). This indicates that the continentality type is oceanic, subtype truly oceanic.
· Total annual Precipitation averages 340 mm (13.4 inches) which is equivalent to 340 Litres/m² (8.34 Gallons/ft²).

Information is available from:
http://www.marble-bar.climatemps.com/
Week 2: information about first case Diavik Mine, Canada
The Diavik Diamond Mine is Canada’s largest diamond mine. The mine site is located in Canada’s remote wilderness on a 20 square kilometer island, at Lac de Gras, Northwest Territories, approximately 300 kilometers from Yellowknife, the territorial capital, and just 220 kilometers south of the Arctic Circle.
Here is the map for Diavik Diamond Mine:

The commodity most in demand is diesel fuel for power and equipment operation.
Diavik’s wind farm began delivering power to its grid on 28 September 2012.
Environmental
· Approximately five million litre – or ten per cent – reduction in use of diesel for power per annum
· Diesel is used both for power and mobile equipment
· Reduction of 100 fuel tanker truckload equivalents per year
· This represents around six per cent of Diavik’s total annual fuel resupply on the winter road 12,000 tonnes – or six per cent – reduction in carbon dioxide per annum
· Six per cent reduction in greenhouse gas emissions per annum
Technical
· Four Enercon E70 generators
· Gearless direct-drive design operating to -40°C
· Total installed and demonstrated capacity: 9.2MW 17GWh annual production – enough to keep 32,300 60 watt light bulbs burning for a year
· Eight year estimated payback
Dimensions
· Tower hub height: 64m
· Turbine rotor diameter: 71m
· Total turbine height: 100m
Information is available from:
http://m2m.riotinto.com/article/lift-diavik-wind-farm
Here is the map for Diavik Diamond Mine:
The commodity most in demand is diesel fuel for power and equipment operation.
Diavik’s wind farm began delivering power to its grid on 28 September 2012.
Environmental
· Approximately five million litre – or ten per cent – reduction in use of diesel for power per annum
· Diesel is used both for power and mobile equipment
· Reduction of 100 fuel tanker truckload equivalents per year
· This represents around six per cent of Diavik’s total annual fuel resupply on the winter road 12,000 tonnes – or six per cent – reduction in carbon dioxide per annum
· Six per cent reduction in greenhouse gas emissions per annum
Technical
· Four Enercon E70 generators
· Gearless direct-drive design operating to -40°C
· Total installed and demonstrated capacity: 9.2MW 17GWh annual production – enough to keep 32,300 60 watt light bulbs burning for a year
· Eight year estimated payback
Dimensions
· Tower hub height: 64m
· Turbine rotor diameter: 71m
· Total turbine height: 100m
Information is available from:
http://m2m.riotinto.com/article/lift-diavik-wind-farm
week2: information about common types of solar cells
Depending on the different types of materials, there four main types solar panels-Crystalline silicon solar panels, Amorphous silicon panels, Chemical dyes panels and Flexible solar cell.
Crystalline silicon solar panels include Monocrystalline solar cells and Polycrystalline silicon solar cells. Amorphous silicon panels include thin film solar cells, organic solar cells. Chemical dyes panels are called Dye-sensitized solar cell.
The most expensive and also most efficiency type is Monocrystalline solar cells. Compared to the Monocrystalline solar cells, Polycrystalline silicon solar cells are cheaper and use simpler materials but the photoelectric conversion efficiency of silicon solar cells will have to reduce a lot. What's more, the its battery life is also shorter than Monocrystalline solar cells. The production method of thin-film amorphous silicon solar cells are completely different and the process is greatly simplified. It can also generate electricity in low-light conditions. However, the conversion efficiency is low and is not stable enough.
Multi-compound solar cells solar cell means not a single element semiconductor material. However, this type do not have the majority of industrial production. A flexible thin film solar cell is a solar cell with respect to a conventional distinguished. Flexible thin-film solar cells are 80% lighter weight. It can be even bent and easy to carry and do not require a special holder in the installation. Its disadvantage is the conversion efficiency is lower than conventional crystalline silicon modules.
http://energyinformative.org/best-solar-panel-monocrystalline-polycrystalline-thin-film/
http://energyinformative.org/best-thin-film-solar-panels-amorphous-cadmium-telluride-cigs/
http://energyinformative.org/amorphous-silicon-solar-panels/
http://en.wikipedia.org/wiki/Solar_panel#Rigid_thin-film_modules
2015年2月9日星期一
week 2: information about five commonly used microgrids
A Microgrid, a local energy network, offers integration of distributed energy resources (DER) with
local elastic loads, which can operate in parallel with the grid or in an intentional island mode to
provide a customized level of high reliability and resilience to grid disturbances. This advanced,
integrated distribution system addresses the need for application in locations with electric supply
and/or delivery constraints, in remote sites, and for protection of critical loads and economically
sensitive development.
The mircogrid can operate in both island mode or grid-connected mode:


These Microgrids are being actively deployed with focus on both physical and cyber security for military facilities in order to assure reliable power without relying on the Macrogrid.


The mircogrid can operate in both island mode or grid-connected mode:
According to the different size, technical sophistication, application/solution and geographic location, microgrids can take a varity of forms and structures from residential. There are five commonly used classes of microgrids:
1.Campus Environment/ institutional microgrids
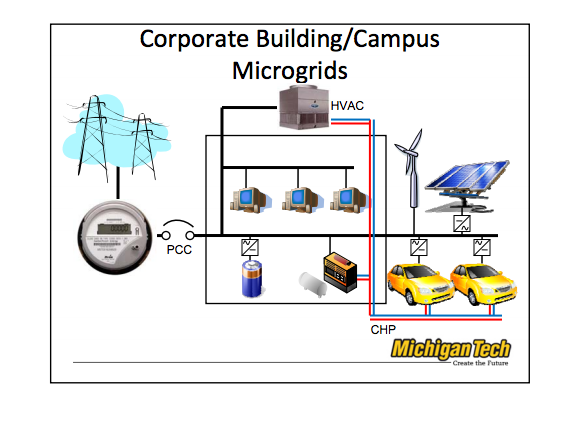
The focus of campus Microgrids is aggregating existing on-site generation with multiple
loads that are co-located in a campus or institutional setting (e.g., industrial park).
2.Remote ''Off-grid'' microgrids

An "off-grid" microgrid is usually built in areas that are far distant from any tras-mission and distribution infrastructure and, therefore, have no connection to the utility grid. Due to this, such a microgrid must have black start capability.
3.Military Base Microgrid
These Microgrids are being actively deployed with focus on both physical and cyber security for military facilities in order to assure reliable power without relying on the Macrogrid.
4.Commercial and industrial microgrids
Main reasons for the installation of an industrial microgrid are power supply security and its reliability. There are many manufacturing processes in which an interruption of teh power supply may cause high revenue losses and long start-up time.
5.Community/utility microgrids
A utility microgrid may include a distribution feeder, a complete medium voltage distribution substation or even several distribution substations in a large area.
In order to design the most suitable microgrid system for different cases, more further study need to be done.
Information is available from:
https://www.google.co.uk/url?sa=t&rct=j&q=&esrc=s&source=web&cd=1&cad=rja&uact=8&ved=0CCAQFjAA&url=http%3A%2F%2Fwww.siemens.com%2Fdownload%3FDLA17_8&ei=bQ3ZVNv_IpXsaM_DgOgH&usg=AFQjCNGmsCSC4H6ErwvvwbbxGKrr2sJWyg&sig2=504NDRHfP_NmqgQZZvs2yg
https://www.securicon.com/sites/default/files/Introduction%20to%20Microgrids%20-%20Securicon%20-%202013_1.pdf
http://www.slideshare.net/jucovas/ssd-final-webpage-31204569?related=10
https://www2.deloitte.com/content/dam/Deloitte/us/Documents/energy-resources/us-er-2014-aes-presentation-es7-topic6-112614.pdf
2015年2月8日星期日
Week 2: a discussion today
Today we discussed the progress for the project.
The final aim of the project is to design and analyse microgrids for different cases, and the jobs are assigned.
Lu Huimin: collect detailed information about renewable energy resources and the basic constructions of frequently used power systems.
Mao Mengkai: search for detailed information for three cases and estimate the scale of the power system for each case.
Shan Xin: focus on Homer Energy and search for data for the devices being used in a microgrid.
Ni Kai (group leader): look for further information for the project and plan for the next step. Also keep on renewing the blog.
2015年2月7日星期六
Summary of the First Week
The name of the project is "Electrical Power System Analysis", and the group members are Kai Ni, Xin Shan, Huimin Lu and Mengkai Mao. The group leader is Kai Ni. This project is supervised by Dr Lin Jiang.
In the first week, the following tasks were raised:
1. Review the background of several energy resources. (In this project we are going to choose wind energy, solar energy, hydrogen energy and fossil fuels as the targets)
2. Design a micro-grid, which is a basic part of an electrical power system. We need to analyse the loads, find available resources and consider the environmental effect, price and efficiency.
3. According to different cases, we need to set up different kinds of power systems to achieve the highest efficiency and cost the least money.
We decided to use the software Homer Energy to analyse the cost of each micro-grid, which helps us design the most suitable electrical power system for each case.
订阅:
评论 (Atom)